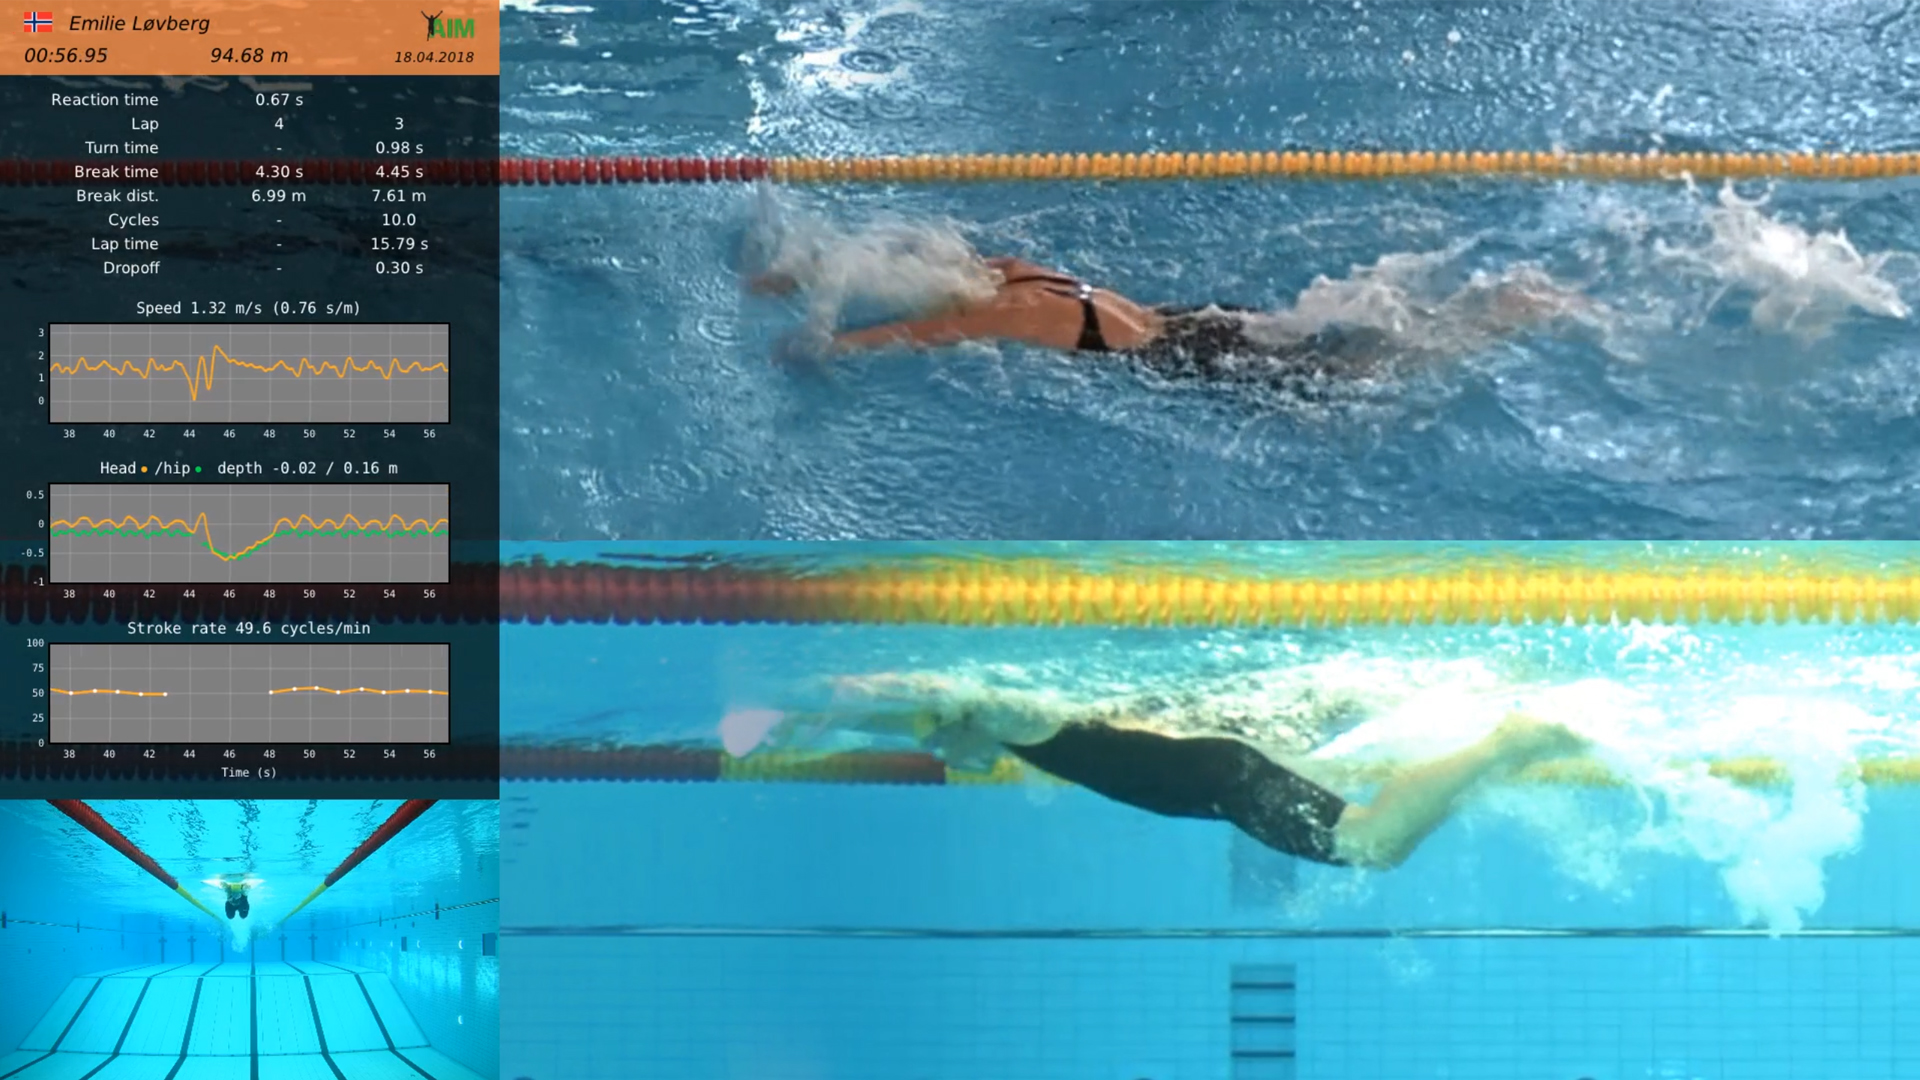
Building a Swimmer Development Dashboard from Race Metrics
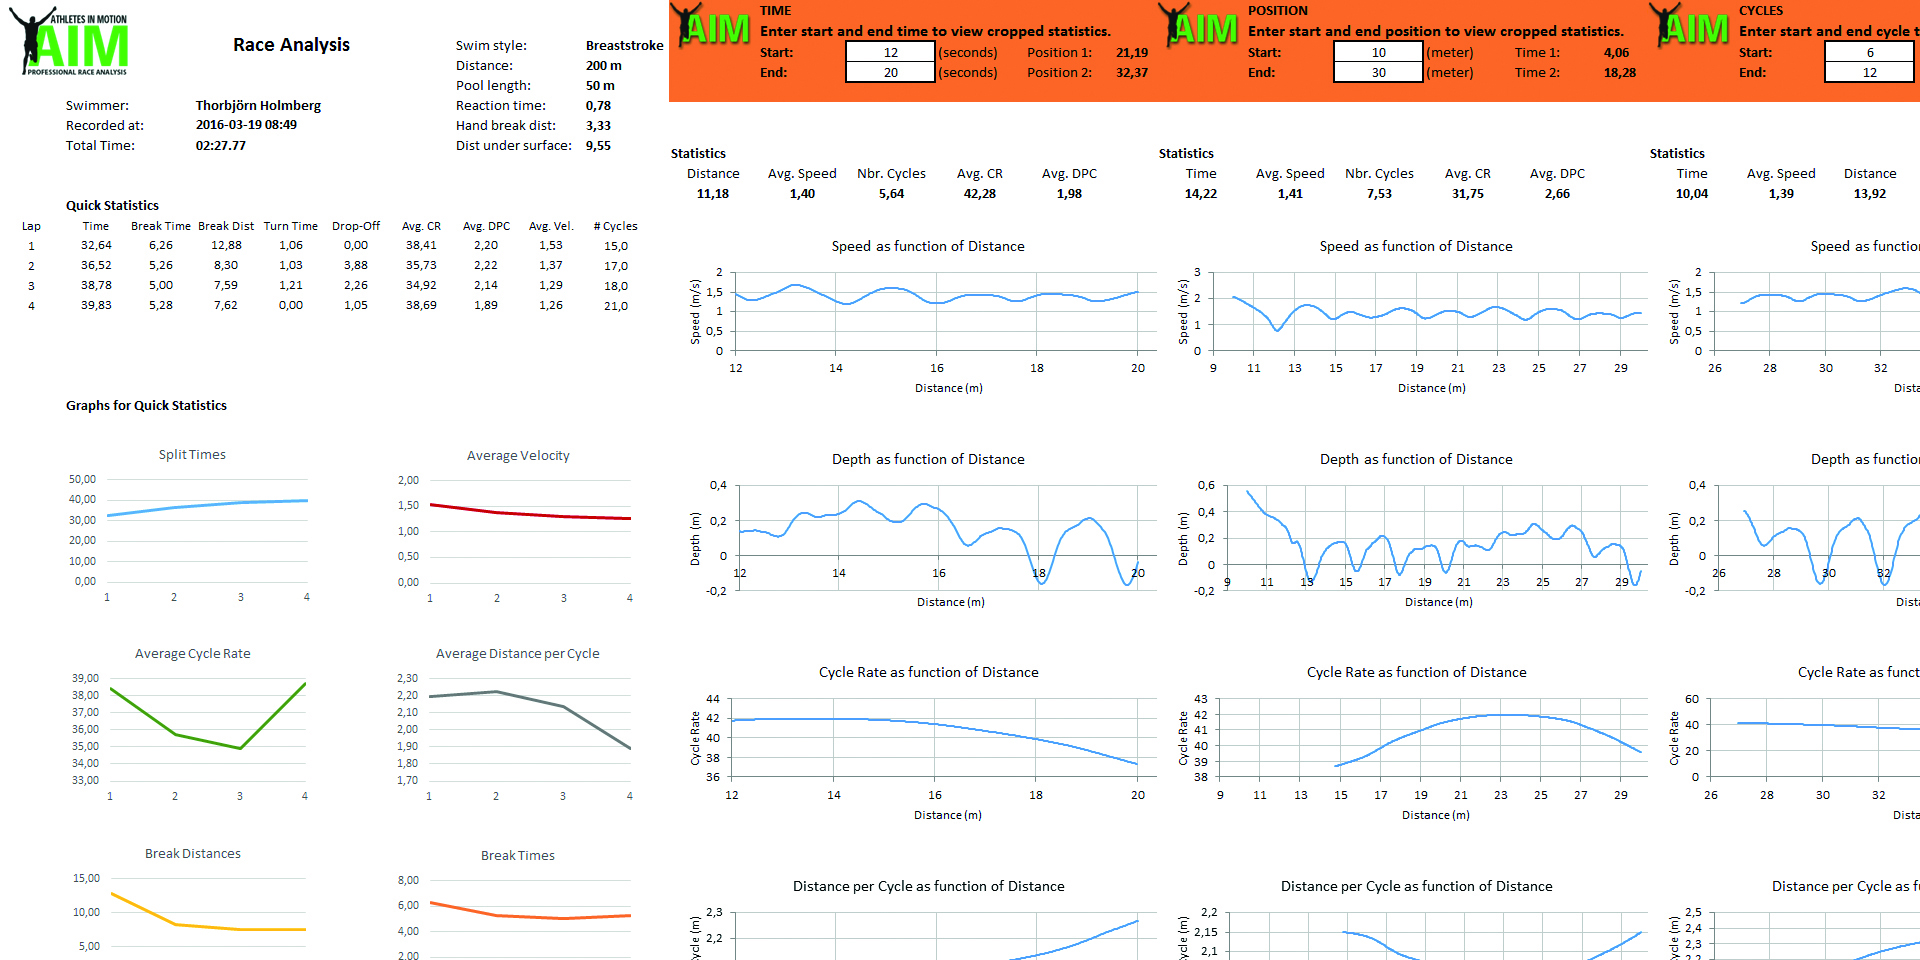
A guide to building a real swimmer development dashboard from automated turn time, breakout, stroke rate, and dropoff data — not another admin tracker.

A guide to building a real swimmer development dashboard from automated turn time, breakout, stroke rate, and dropoff data — not another admin tracker.
Averaging breakout distance hides the real problem — race-to-race variance is what actually signals technical fatigue and inconsistent turns.
A practical comparison of manual, hand-tagged video analysis and automated camera-based race analysis for university and national swim programs.
Breakout distance, not just breakout time, reveals whether a swimmer is truly using the underwater phase — here's why it's worth tracking.
Breakout distance is one of the clearest fatigue signals in a race, and most coaches never see it change lap by lap.
Tethered speedometers and IMUs can measure turn speed, but they require gear on the swimmer. Here's how camera-only video analysis compares.
Wearables track motion. Cameras track technique. Here's why more swim clubs are choosing markerless, camera-only analysis over sensor-based systems.
No sensors, no markers, no wearables — just cameras and software reading stroke mechanics with a precision most sensor systems can't touch.
A faster time doesn't tell you why a swimmer improved. Here's how video-based race data adds the technique layer that time-only season comparisons miss.
FINA points, wall velocity, and stroke mechanics aren't spreadsheet problems — they're measurement problems, and Excel can't measure anything.
Breakout distance reveals whether a swimmer's underwater kick strength actually matches their race strategy — here's how to read it correctly.
Coaches who want parents and swimmers to actually check a development dashboard need three metrics, not thirty — here's which ones work and why.
Social Contact