
A stopwatch tells you a swimmer went 58.2 seconds for 100m freestyle. It doesn’t tell you why. That’s the problem with lap-by-lap time data: without it, a technical breakdown hides inside a final number that still looks “fine.”
Here’s the direct answer: lap-by-lap time data catches a breakdown because it isolates exactly where a swimmer loses time, not just how much total time they lost. A swimmer can hold their overall pace and still be quietly falling apart on every turn.
Why total time hides the real problem
Imagine a 100m breaststroke swimmer whose final time barely changes from one meet to the next. A coach watching with a stopwatch sees consistency. But underneath, their turns might be getting slower every single lap, while their clean swimming speed stays sharp enough to mask it.
Research from the Norwegian School of Sport Sciences (Olstad et al., 2020) found exactly this pattern in short-course 100m breaststroke. Turn time made up the largest share of total race time, around 44 percent, more than clean swimming itself. The study also found that turn-out time got progressively slower across the race, worsening by roughly 0.38 seconds by the final turn compared to the first. That decline came mainly from a weaker push-off and a shorter breakout distance, not a slower pivot at the wall.
A stopwatch on the deck can’t see any of that. It gives you one number at the finish. It can’t tell you the turn breakdown started on lap two, or that push-off strength is fading well before fatigue shows up in stroke count.
What lap-by-lap data actually shows a coach
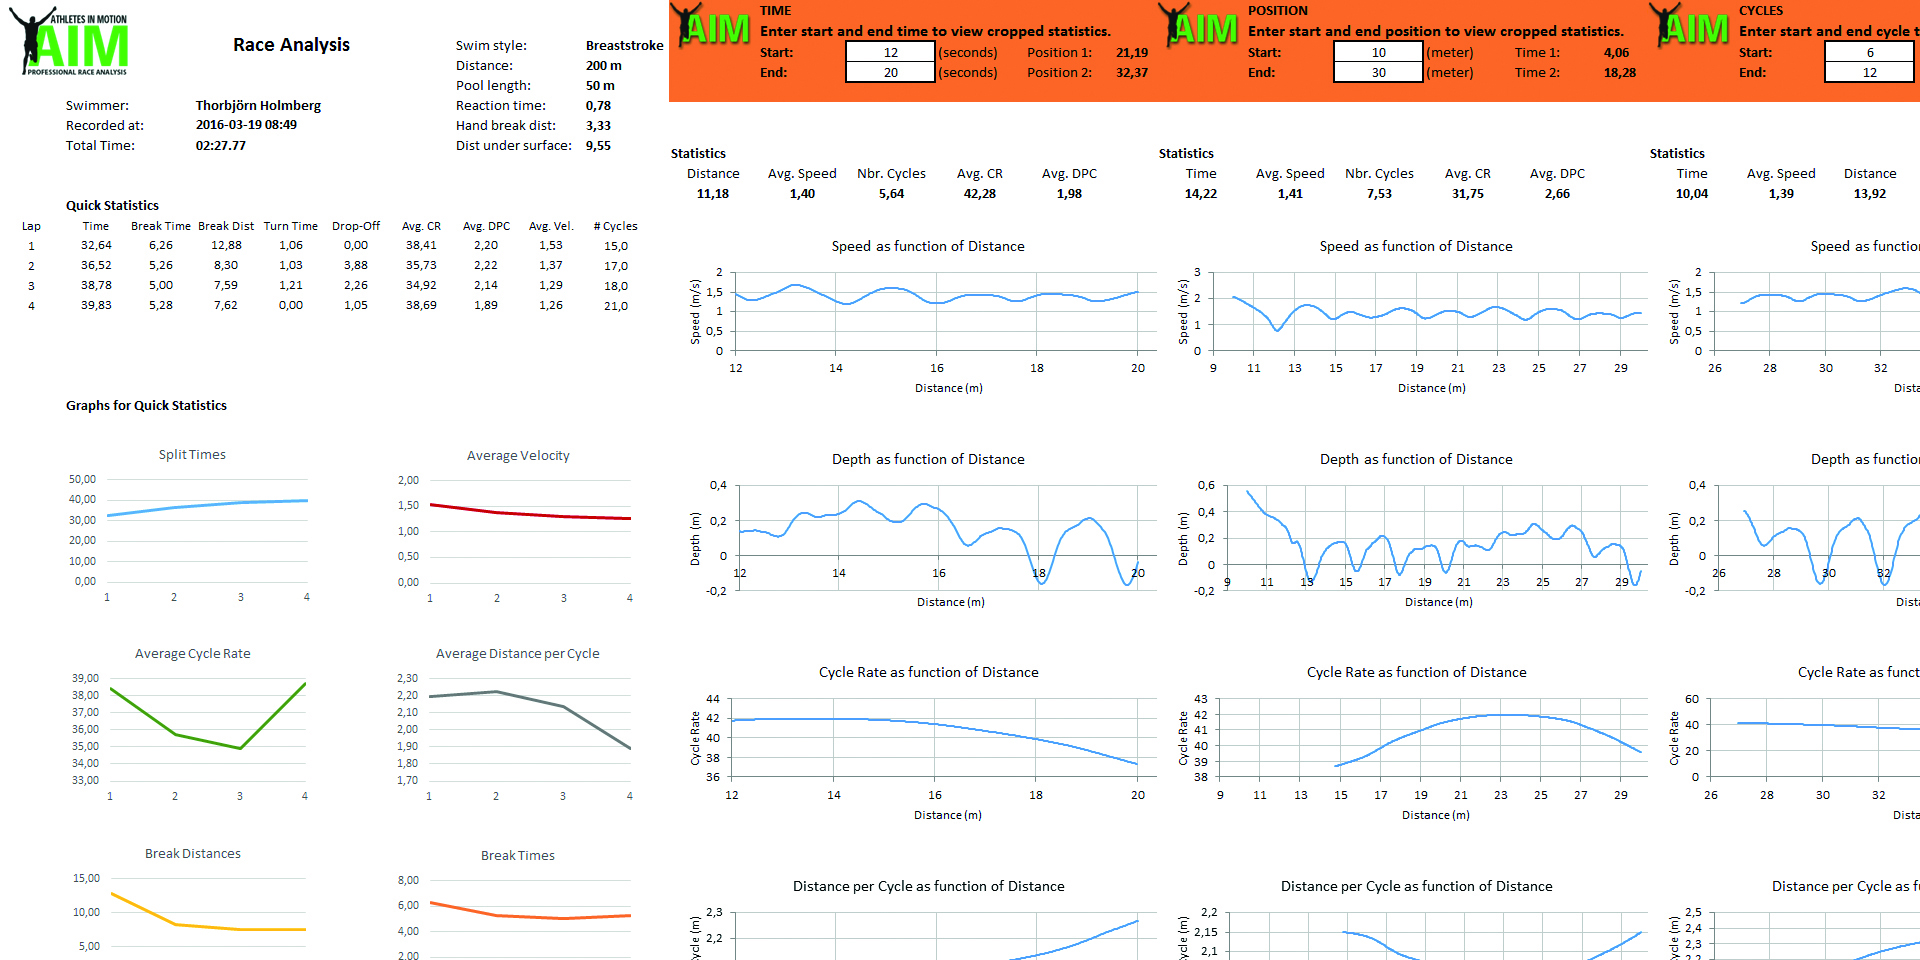
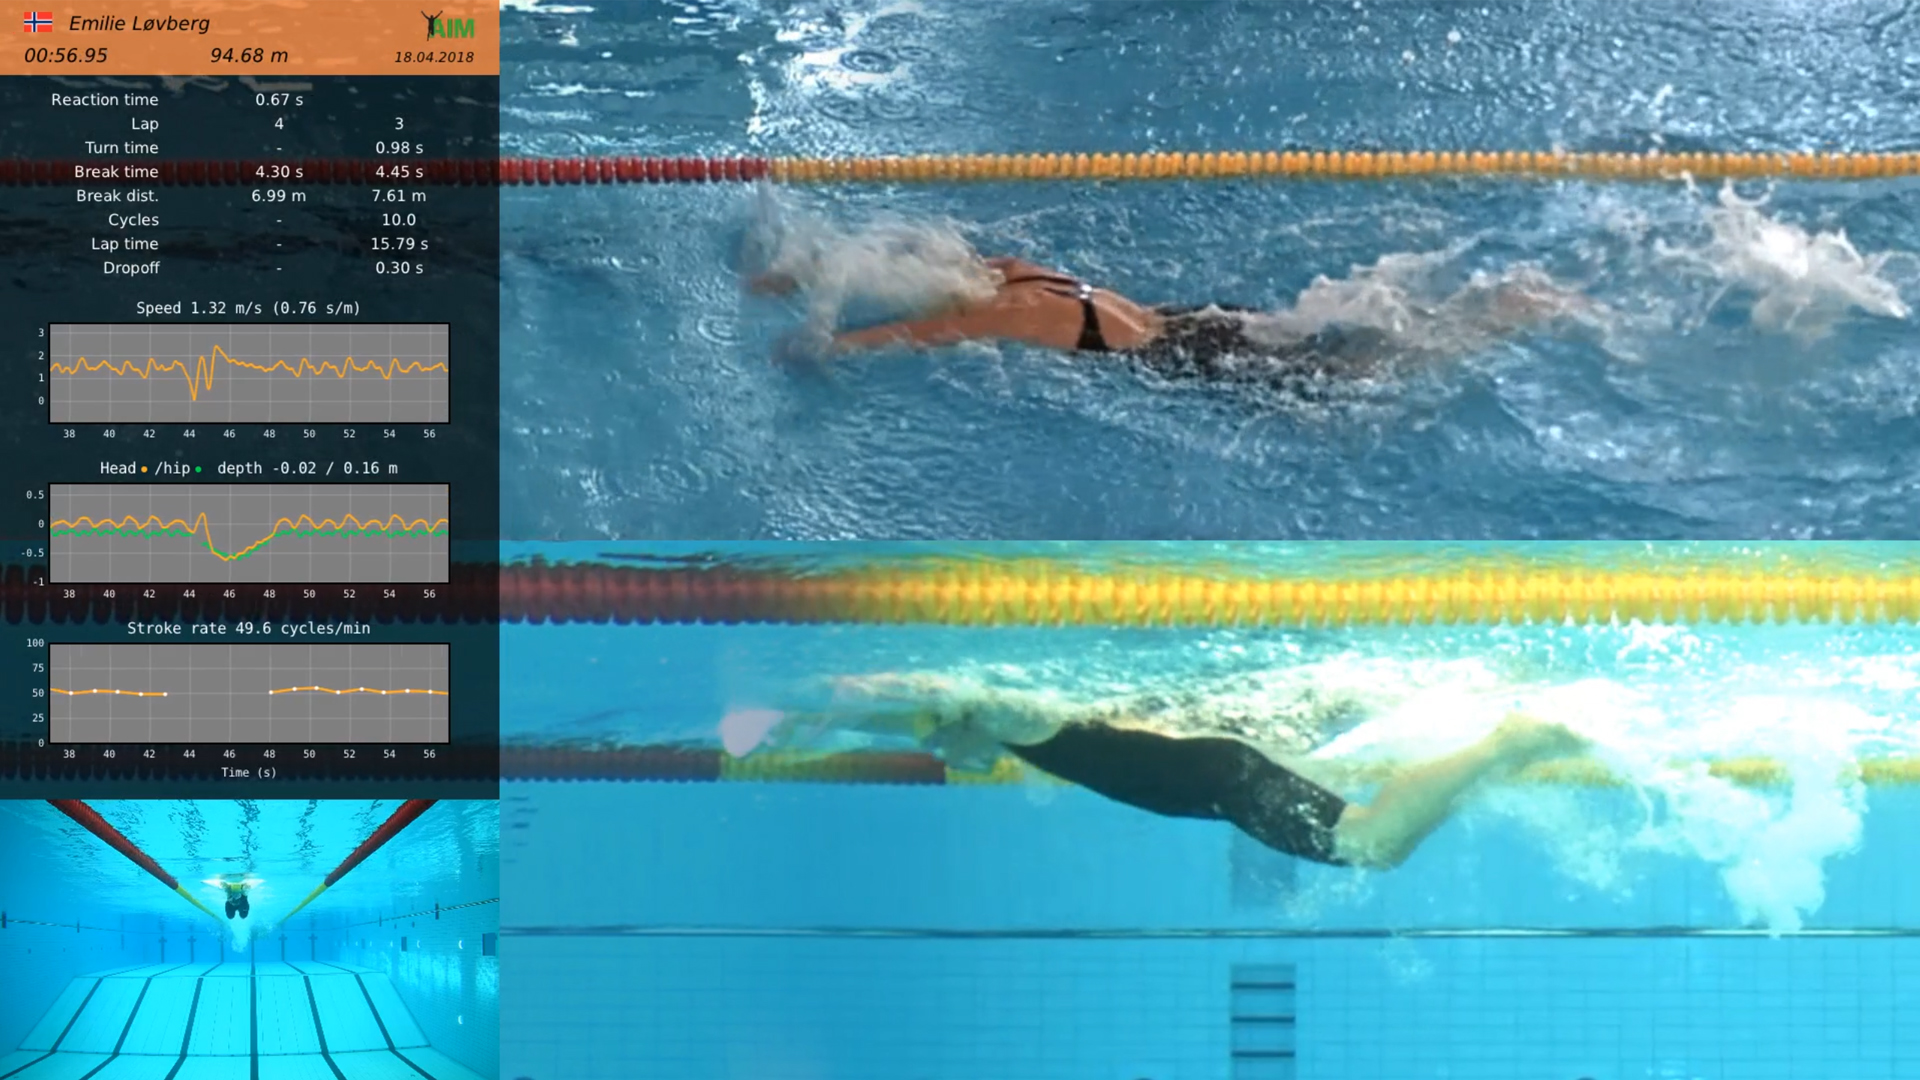
This is where AIM Systems’ automated capture changes what a coach can see. Every lap gets broken into turn time, breakout distance, and lap time, plus a dropoff figure comparing each lap to the one before it. Instead of one final number, a coach gets a full shape of the race.
If dropoff climbs steadily on turns three and four but stays flat elsewhere, that’s not fatigue in the swim itself. That’s a breakdown in turn technique specifically, likely tied to push-off strength or breakout distance, exactly the mechanism the Olstad research points to.
- Lap time alone shows pace holding steady.
- Turn time reveals if a specific wall is slowing the swimmer.
- Breakout distance shows if push-off power is dropping.
- Dropoff quantifies exactly how much each lap costs compared to the last.
None of this requires guesswork. The system’s fixed cameras track the swimmer through the entire race, and the software automatically stitches and analyzes the footage afterward. For a 100m swim, the complete video and data package is ready in about four minutes.
Turning lap-by-lap time data into a fix
Once a coach sees which lap or which turn is losing time, the conversation with the swimmer changes. It’s no longer “swim faster.” It’s “your push-off on turn three is 0.3 seconds slower than turn one, let’s work on that specific wall.” That’s a coachable, specific fix instead of a vague instruction.
A swimmer’s own past races become the baseline too. AIM Systems lets a coach compare a new swim lap-by-lap against that same swimmer’s previous best times, so a fading turn shows up immediately against their own history, not just against the field.
If you want to see what lap-by-lap breakdowns look like on your own swimmers, get in touch with AIM Systems. No pressure, just a look at the data.
Frequently asked questions
Why doesn’t a stopwatch catch a technical breakdown during a race?
A stopwatch only captures total or split times, so a swimmer can hold overall pace while specific turns or laps quietly get slower underneath.
What is dropoff in swim analysis?
Dropoff is the change in lap time compared to the previous lap, and it’s one of the metrics AIM Systems measures automatically for every lap.
Which part of a race loses the most time in breaststroke?
Research from the Norwegian School of Sport Sciences (Olstad et al., 2020) found turns accounted for about 44 percent of total finishing time in short-course 100m breaststroke, more than clean swimming.
Sources
- Olstad, B.H., Wathne, H., & Gonjo, T. (2020). Key Factors Related to Short Course 100 m Breaststroke Performance. International Journal of Environmental Research and Public Health, 17(17), 6257. https://doi.org/10.3390/ijerph17176257
Social Contact