
Some swimmers pop up off every wall a full body length before they need to. It looks fine on deck. It rarely gets flagged by eye. But it costs time on every single lap, and most coaches never catch it without data.
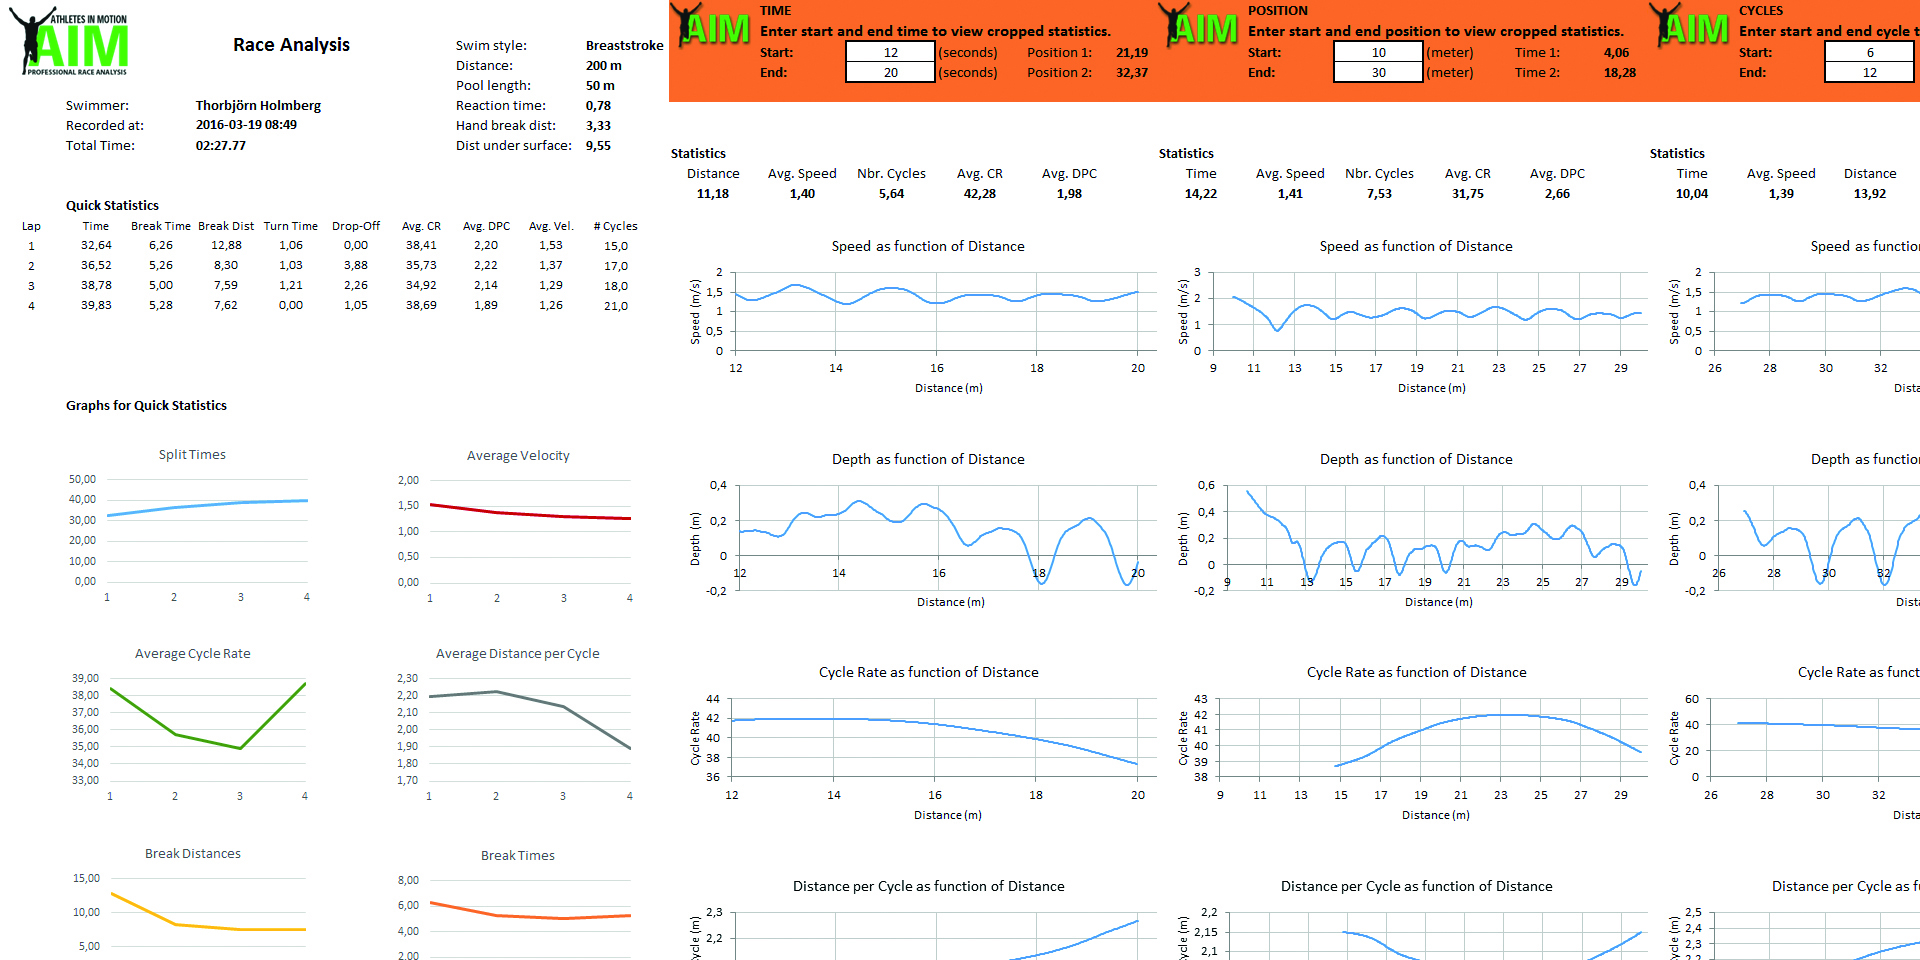
This is what breakout distance measures: how far the swimmer travels underwater before the head surfaces after a turn or a start. Surface too early, and the swimmer trades a fast underwater phase for slower surface swimming before they’ve earned the speed back.
Why Swimmers Surface Too Early
Underwater kicking, when done well, is usually faster than surface swimming. That’s true for most competitive swimmers, especially off a wall where push-off speed is still carrying them forward. Surfacing early throws that speed advantage away.
Often it’s habit, not ability. A swimmer trains breakout timing at practice pace, then never adjusts it for race speed. Anxiety plays a role too — some swimmers surface early simply because they want air, not because it’s the fastest option.
Fatigue changes the picture as well. Research by Craig, Skehan, Pawelczyk, and Boomer (1985), which studied U.S. Olympic Trials swimmers, found that distance per stroke drops for everyone late in a race. But faster swimmers held their stroke rate steady, or even raised it, to compensate. Slower swimmers let it fall too. That same idea of managing decline under fatigue applies to breakouts — a swimmer who surfaces early on lap one out of habit will often surface even earlier by lap six out of fatigue, compounding the loss.
What Breakout Data Actually Shows
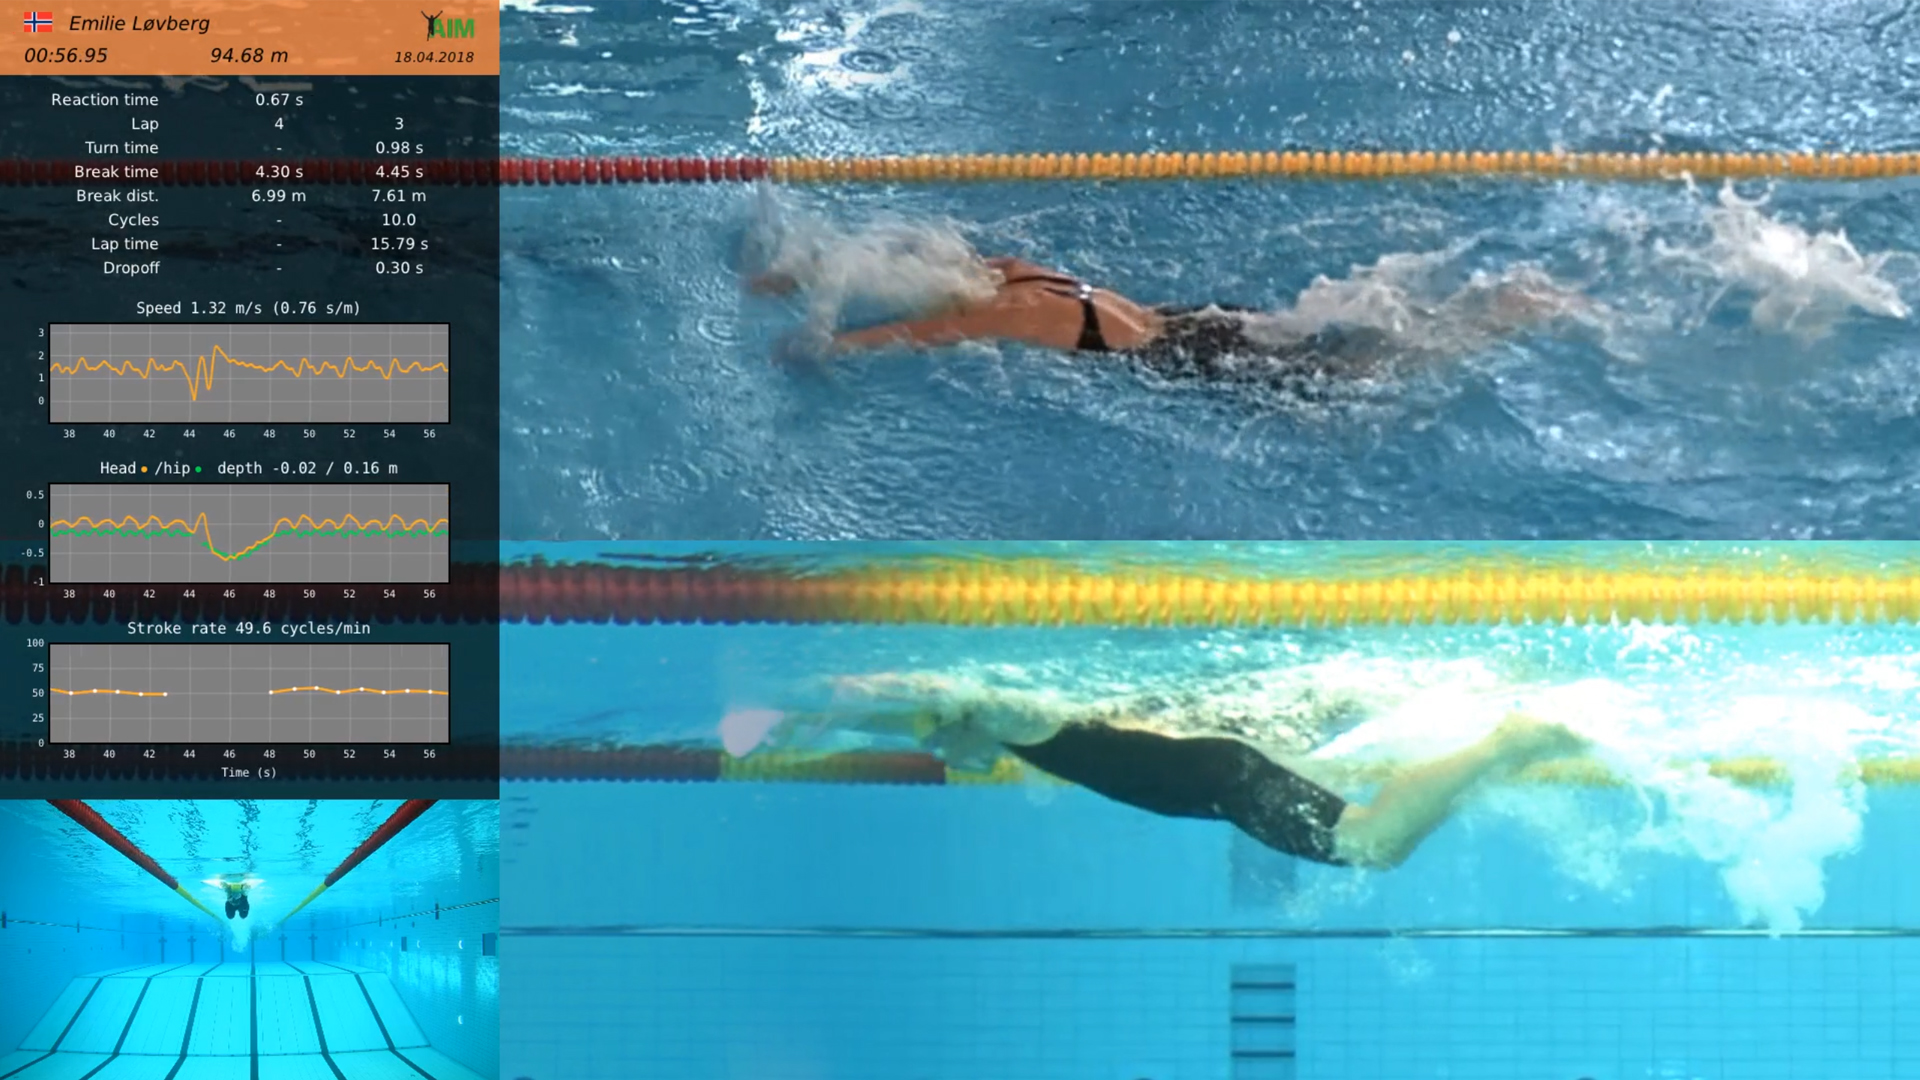
Eyeballing a breakout from the pool deck gives you a rough guess. A camera system gives you the number. AIM Systems tracks breakout time and breakout distance on every lap, for every wall, automatically, using the same fixed camera setup that also captures turn time and stroke count.
Because the system uses cameras above and below the water, it can see exactly where the head surfaces — not just when. That’s a detail a stopwatch and a coach’s eyeline simply can’t capture consistently, lap after lap, across an entire practice.
Once you have that number, the coaching conversation changes. Instead of telling a swimmer to “stay under longer,” you can show them: last week they broke out at 4.5 meters, this week at 3.8 meters, and their lap time got slower, not faster. That’s a concrete, specific comparison — not a guess.
Turning Breakout Data Into Better Racing
The fix usually starts with underwater speed testing. Time a swimmer’s underwater kick speed against their surface swimming speed at race pace. If the kick is faster, and it usually is early in a race, extending the breakout is the right call.
Then track it over time. AIM Systems compares a swimmer’s breakout distance lap-by-lap against their own past personal-best swims, or against a teammate’s times, so you can see whether the adjustment is actually holding up under race pressure, not just in a controlled drill.
This is where the automated capture pays off. Film the swim, and the system syncs, stitches, and analyzes the footage automatically. A 50m race is fully processed in about 2 minutes, a 100m in about 4. That’s fast enough to review breakout data with a swimmer between events, not just after the whole meet is over.
If you want to see how this looks with your own swimmers, get in touch with AIM Systems — no pressure, just a conversation about what’s measurable in your pool.
Frequently asked questions
What is breakout distance in swimming?
Breakout distance is how far a swimmer travels underwater off a start or turn before their head surfaces to begin surface swimming.
Why do swimmers surface too early off the wall?
Most swimmers surface early out of habit or a desire for air, not because it’s actually faster, and fatigue tends to make the problem worse as a race goes on.
How does AIM Systems measure breakout distance?
AIM Systems uses fixed above- and below-water cameras to automatically detect the exact point a swimmer’s head surfaces on every lap, without any wearable sensors.
Sources
- Craig, A.B., Skehan, P.L., Pawelczyk, J.A., & Boomer, W.L. (1985). Velocity, stroke rate, and distance per stroke during elite swimming competition. Medicine and Science in Sports and Exercise, 17(6), 625-634. https://doi.org/10.1249/00005768-198512000-00001
Social Contact