
Start entry distance is where a swimmer’s body lands in the water after diving off the block. It changes as swimmers grow, gain strength, and refine their technique. Coaches who track it over time can see development that a stopwatch alone will never show.
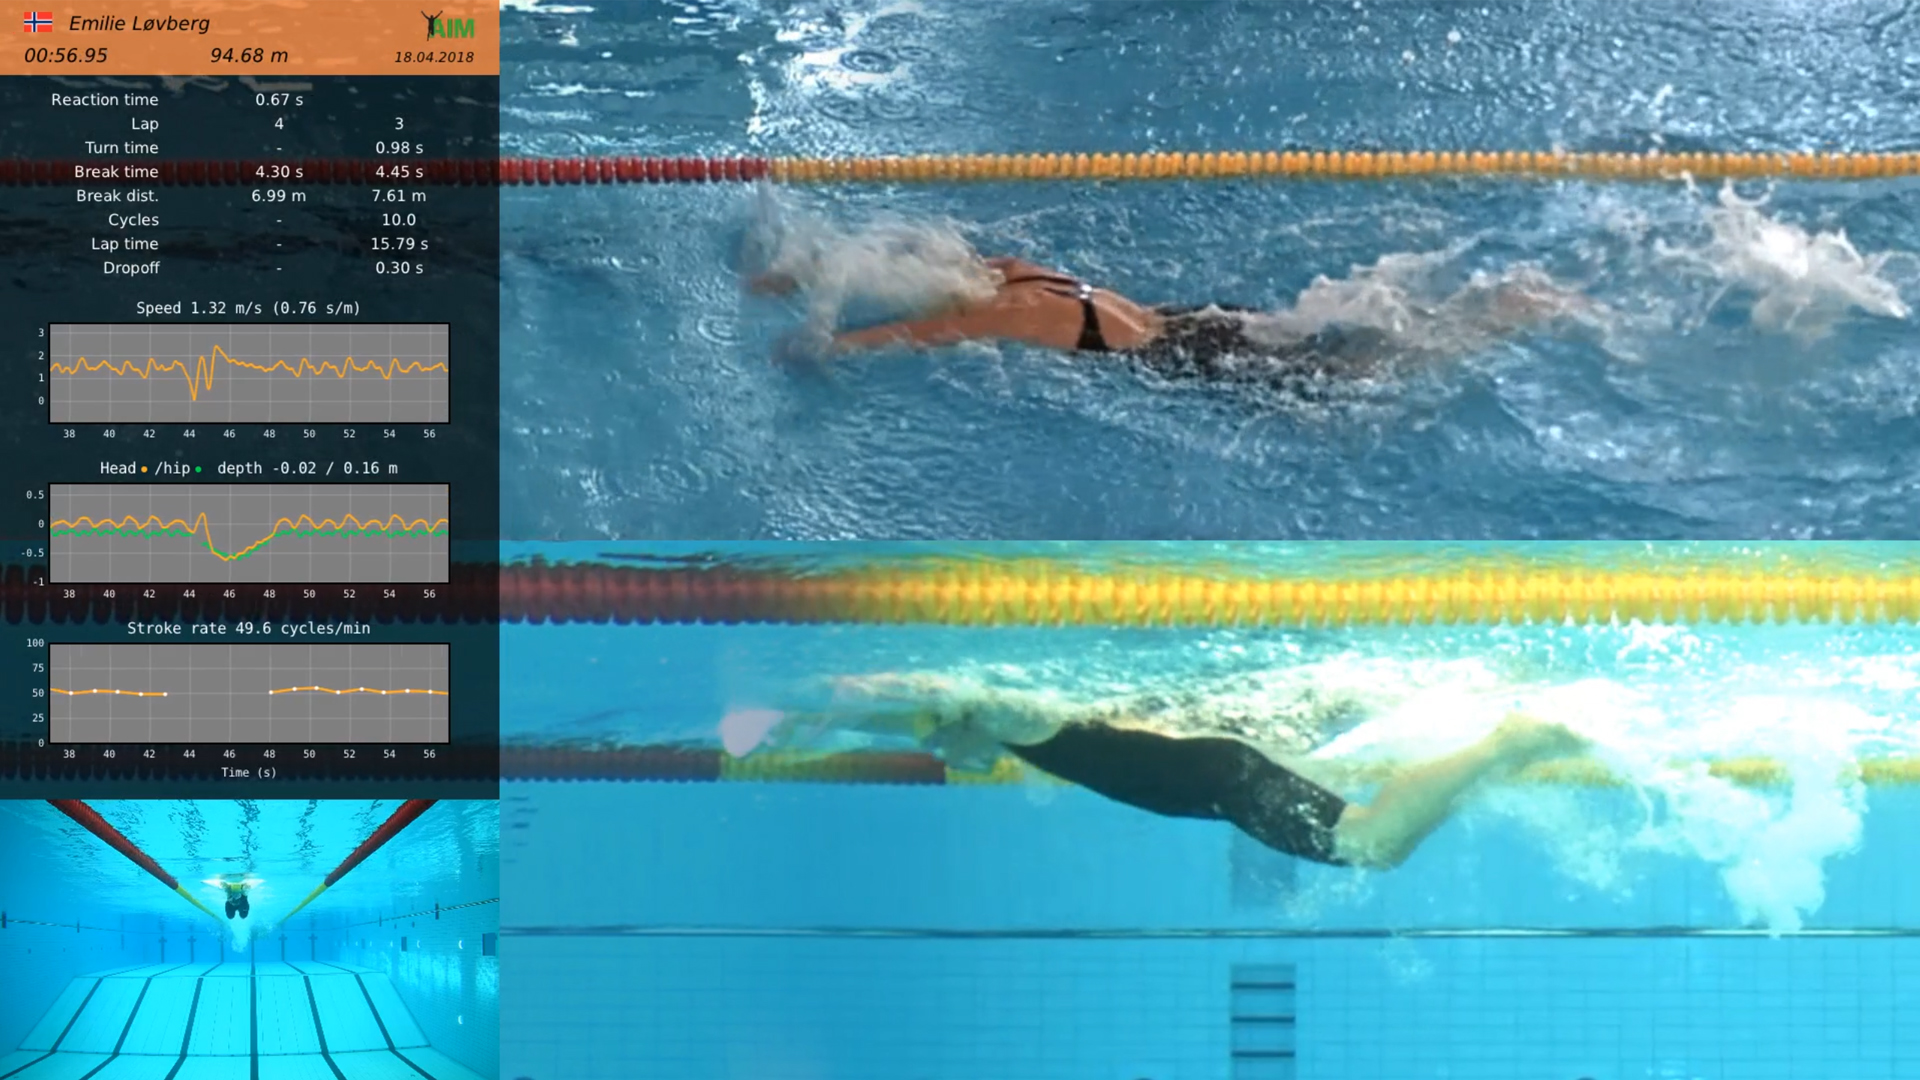
A younger or weaker swimmer often enters the water short and steep. There isn’t enough hip and shoulder power to drive the body flat and far off the block. As strength increases, especially in the legs and core, the entry point moves further out. The dive becomes flatter, faster, and covers more distance before the swimmer even starts kicking underwater.
Why Start Entry Distance Shifts With Development
Three things usually move together as a swimmer develops: block power, body control in the air, and entry angle. More leg drive means more horizontal velocity leaving the block. Better core control means the body holds a tighter, more efficient shape through the air instead of collapsing or arching.
This is exactly why comparing start entry distance to a fixed number — “elite swimmers land at X meters” — is risky. Research from Gonjo and Olstad’s 2021 review in the International Journal of Environmental Research and Public Health found that race-analysis studies rarely agree on how to define these segments. The review looked at 22 studies and found the turn segment alone had been defined seven different ways. That inconsistency means published benchmarks don’t transfer cleanly between swimmers, ages, or even labs.
The more useful comparison is a swimmer against themselves. Track entry distance across a season, and you’ll see whether strength gains in the weight room are actually translating into a better start.
What to Watch Alongside Entry Distance
Entry distance alone doesn’t tell the whole story. It matters most alongside underwater speed after the start — how fast the swimmer travels once they’re in the water. A longer entry paired with slow underwater speed usually means the swimmer is floating off the dive rather than driving through it.
- Entry distance — where the body lands after the dive
- Underwater speed immediately after entry
- Breakout distance — where the head surfaces
This is where automated tracking earns its place. AIM Systems’ fixed camera installation captures start entry distance and underwater speed automatically on every dive, without a coach eyeballing a splash point from the pool deck. Because the system is calibrated once at installation, coaches get consistent, comparable numbers swim after swim, season after season — not estimates that vary depending on who’s watching.
That consistency matters more than it sounds. A coach guessing entry distance by eye might be off by half a meter without realizing it. A camera-based system removes that guesswork entirely, and gives a swimmer’s own past starts as the real benchmark for comparison.
If you’re coaching a swimmer through a growth spurt or a heavy strength block, start entry distance is one of the clearest windows into whether that physical change is showing up in the water yet.
Curious how this looks with your own swimmers? Get in touch with AIM Systems to see it in action.
Frequently asked questions
Does start entry distance always increase as a swimmer gets stronger?
Generally yes, because more leg drive and core control off the block produce a flatter, longer dive, but technique refinement matters as much as raw strength.
Why shouldn’t coaches compare entry distance to a fixed benchmark number?
Research reviewing race-analysis studies found no consistent definition of race segments across labs, so published benchmarks don’t reliably transfer between swimmers or settings.
What should coaches track alongside start entry distance?
Underwater speed right after entry and breakout distance, since a long entry with slow underwater speed usually signals the swimmer is floating rather than driving off the dive.
Sources
- Gonjo, T., & Olstad, B.H. (2021). Race Analysis in Competitive Swimming: A Narrative Review. International Journal of Environmental Research and Public Health, 18(1), 69. https://doi.org/10.3390/ijerph18010069
- Craig, A.B., & Pendergast, D.R. (1979). Relationships of stroke rate, distance per stroke, and velocity in competitive swimming. Medicine and Science in Sports, 11(3), 278-283. https://doi.org/10.1249/00005768-197901130-00011
Social Contact